
The answer of the question I asked in my last post is Statistics. Query Optimizer is a cost(and rule) based optimizer. It calculates the costs for each operator based on its formulars behind and get the total estimated cost of query. If there are more alternatives to implement the same logic, SQL Server will know the cost of each alternative, then it can pickup a most efficient one to run. However, databases nowadays are usually complicated. Very frequently, implementing a logic for data accessing can have millions of alternatives. Getting cost for each and find the cheapest best one is just so time consuming. It doesn’t make sense to take a day to find a best plan to execute where the returning of the query can be done in 10 minutes by using the wrost plan. There are definitely some rules behind. We will come back to the rule in the future. Now let’s see how SQL Server gets estimated number of rows on the data it maniputes on.
SQL Server maintains a very special structure to keep track of number of changes, which is called statistics. By default, they are created and updated altomatically, but this can be turned off by ALTER DATABASE statement. When a table is created, there is no Statistics being created even you have index created. After inserting rows to the table, the statistics is still not created. Why? Because stats are only useful for searching. If no searching taking place, no stats are needed. Once you have a query running against a table with WHERE clause on columns, the stats will be created. This creation is synchronous. This is one of the reason why a query runs slow in first time but fast the second time. Look at the code below
use test
go
alter database test set auto_update_statistics on
alter database test set auto_create_statistics on
go
--- create some records
if object_id('Mytest') is not null
	drop table Mytest
go
create table Mytest(ID int, V1 int, V2 int)
go
set nocount on
declare @i int
select @i = 1
while @i<1000
begin
	insert into Mytest(ID, V1, V2)
		values(@i, cast(RAND()* 10000 as int), cast(RAND()* 10000 as int))
	select @i = @i +1
end
go
-- check if there're any stats in the system
select * from sys.stats where object_id = object_id('Mytest')

----No Record Returned
Issue a SELECT statement
select * from Mytest where V1 = 100
---check again
select * from sys.stats where object_id = object_id('Mytest')

/*
object_id   name                        stats_id    auto_created user_created no_recompute has_filter filter_definition
----------- --------------------------- ----------- ------------ ------------ ------------ ---------- -----------------
597577167   _WA_Sys_00000002_239E4DCF   2           1            0            0            0          NULL
*/
Something interesting is returned from sys.stats table. Stats _WA_Sys_00000002_239E4DCF is generated automatically by SQL Server. “WA” means Washington. Sys means system generated. Other parts are numbers to make it unique. In this case, the table does not have any indexes, we know that there is no plan alternatives for seaching value 100 over V1 column, why SQL server still need to calculate statistics? The reason is that SQL Server needs to know number of rows will be returned from the scan operator. Based on that, it can estimate memory for this query. SQL Server will base on this estimate to allocate memory for the query. I will come to that in my future posts.
Let’s see what’s in the statistics:
dbcc show_statistics(Mytest, _WA_Sys_00000002_239E4DCF)
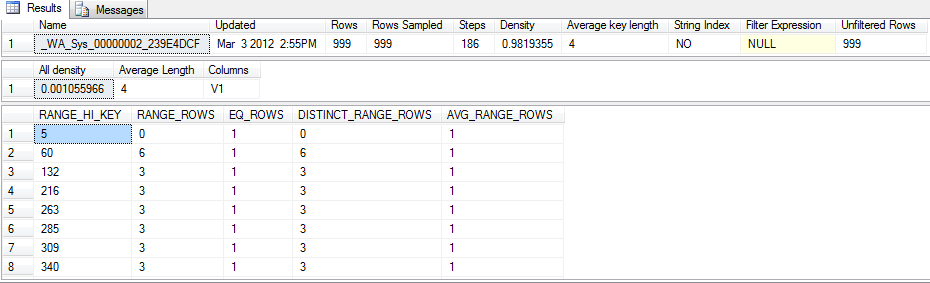
The first set tells us stats name, when it’s updated, number of rows. Number of rows Sampled. In this case, since the table is small, SQL Server sampled all rows. For big tables, sampling all rows can be very resource intensive. There are options in SQL Server to only update a percentage of rows to be sampled. Density is not used by query optimizer in SQL Server 2008 according to BOL. Average Key Length tells how big the row is. Steps means number of rows in the third returned set. Rest of the field is very straight forward as their column names.
All density field in the second returned set tells us number of distinct rows for column V1, 1/0.001055966 = 947. Run “select distinct v1 from Mytest” can prove that. Average length of V1 column is 4 in this case as well.
Let’s look at the second row in the third set. This row tells us there is a key with value V1 = 60 (RANGE_HI_KEY). There is only one row that V1 = 60 (EQ_ROWS). There are 6 rows (RANGE_ROWS) from previous value to current value, which is range of 5< V1 < 60. Within range 5< V1 < 60, distinct row count is 6 (DISTINCT_RANGE_ROWS). AVG_RANGE_ROWS = RANGE_ROWS / DISTINCT_RANGE_ROWS.
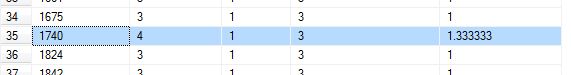 Let’s scroll down the third set little bit and look at row 35. From range 1675 < V1 < 1740, there are 4 rows, 3 distinct rows. The average range rows are 1.333333.
Now run SQL Statement below.
Let’s scroll down the third set little bit and look at row 35. From range 1675 < V1 < 1740, there are 4 rows, 3 distinct rows. The average range rows are 1.333333.
Now run SQL Statement below.
 select V1 from mytest where V1 > 1675 and V1 < 1740 order by V1
/*
V1
———–
1696
1703
1703
1734

(4 row(s) affected)
*/
There are 4 rows with 1 duplication. Now let’s run SQL with execution plan included
select * from Mytest where V1 = 1703
select * from Mytest where V1 = 1704
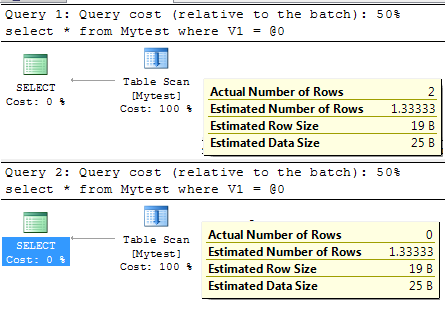
The actual Number of row for the first query is 2 but the estimate is 1.333333 where the actual number of row return from second query is 0 but estimate is same as the first one.
SQL Server uses this way to get estimated number of rows. Stats can only have up to 200 rows (steps). It records the distribution of the key value(s). It can be accurate if the distribution of the key value is even, but can’t be otherwise.
Run “dbcc show_statistics(Mytest, _WA_Sys_00000002_239E4DCF) with stats_stream”, you can get content of the stats. Pass the stats stream to CREATE STATISTICS statement, you can create exactly the same same stats on the table. When analysing a query plan in QA environment, the query plan generated may not be the same as waht is generated in production. But you can use this way to copy production statistics to QA to mimic the production environment rather than making a copy of production. If you decide to do so, remember to turn off auto stats update at the database level in QA or Dev.
Stats is like a special index but it’s stored in binary format. It’s stored in a system table called sys.sysobjvalues. Use Dedicated Admin Connection to the test database and run
select * from sys.sysobjvalues where objid= object_id('Mytest')
/*
valclass objid       subobjid    valnum      value   imageval
-------- ----------- ----------- ----------- ------- ----------------
60       597577167   2           0           999     0x0700000013E...
*/

select datalength(imageval) from sys.sysobjvalues where objid= object_id('Mytest')
/*

--------------------
6130

*/
The stats stream is saved in imageval column of sys.sysobjvalues. Length of this stats is 6130 bytes.
You have: “Let’s scroll down the third set little bit and look at row 35. From range 1675 < V1 < 1740, there are 4 rows, 3 distinct rows. The average range rows are 1.333333. "
When you only populated the table with RAND()*1000, how did you get ANY rows, let alone 4 rows between 1675 and 1740?
PS When you inserted, the cast wasn't required, it would have implicitly done the cast for you.
Thanks for reminding about the cast. I am just little bit defensive on programming. When I populates those tables, I don’t know the data distributioin. I got those ranges after reading the numbers from the stats and then use query to double check. Definitely my code here can’t reproduce the result I got.